
U.S. Unemployment
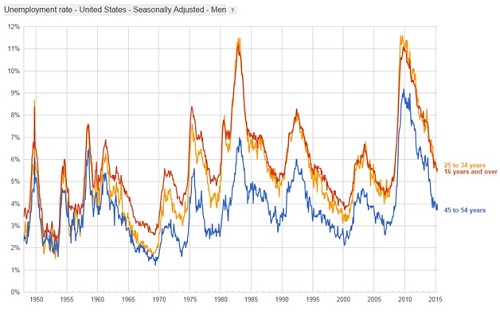
Recently, the U.S. unemployment rate hit its lowest level since 2008 (5.3%). Since 1950, the U.S. economy has gone through cycles of economic growth and contraction—a reasonable pattern for free market economies. The chart below shows the historical unemployment rate in the U.S. from 1950 to 2015 (as of April 2015). Note that men between 45 -54 enjoy the lowest rate of unemployment.
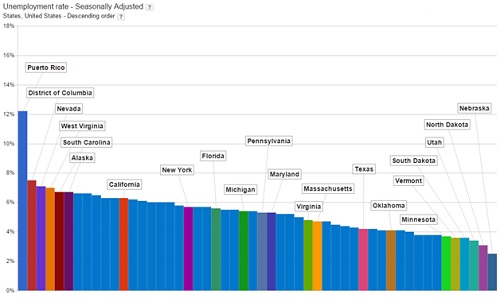
The second chart shows the unemployment rate for the U.S. and its three large states (Nebraska, California, and Texas). Among large states, Texas is the one with the lowest unemployment rate; California with the highest. It is somewhat puzzling why Nebraska has the lowest unemployment rate. One theory is that it does not have a single dominant industry so it is less likely to fall victim to fluctuations in industries.
Since 2007, all of these three states have similar pattern of unemployment rates, but Nebraska was as greatly impacted by the economic meltdown as were the other two.

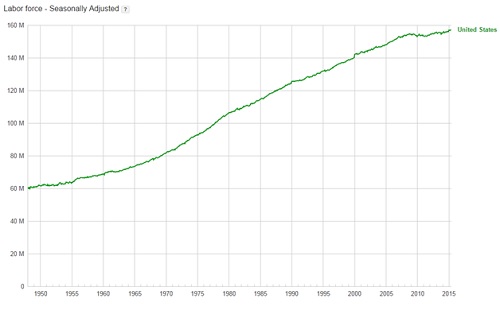
The following two charts show the U.S. labor force and unemployment rate for various states. The labor force (total workers working or looking for work) in U.S. has been relatively flat over the last few years; predictable, given the recent economic meltdown.
Source: Google